Dr. Seema Javed
According to a report by Climate Central -Warming trends in India increase the chances of uncomfortably and possibly dangerously hot conditions during March-April. The northern and western regions of India have the fastest warming, with the largest change since 1970 in March occurring in Jammu and Kashmir (2.8°C). Warming is more uniform in April and Mizoram has the largest change since 1970 (1.9°C).
India has increased risk of extreme heat during Holi
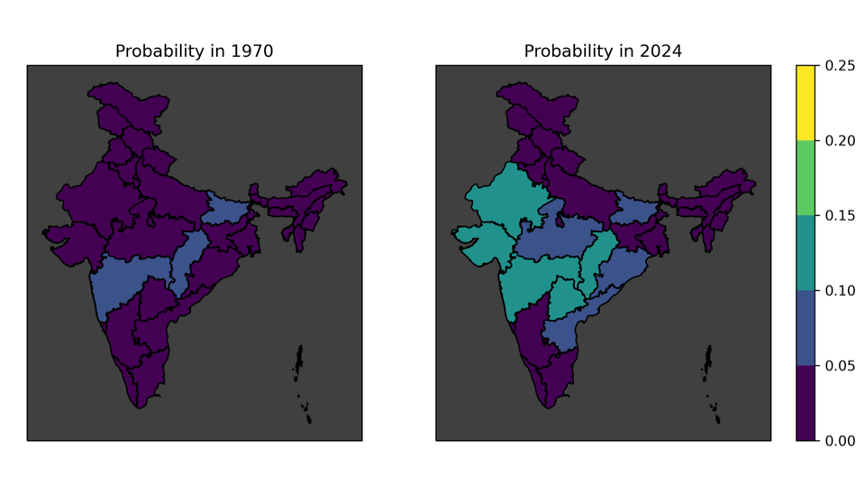
Hot temperatures are an increasing health concern in India and around the world. For this analysis, we focused on the chance that people celebrating Holi would encounter temperatures above 40°C (detailed methods below). In the climate of the early 1970s, it would be exceedingly rare to encounter temperatures in late March above 40°C. Maharashtra, Chhattisgarh, and Bihar were the only states in that period with more than a 5% chance of reaching these temperatures.
In contrast, in this year’s climate, the chance of reaching 40°C expands to nine states in total: the three original states plus Rajasthan, Gujarat, Telangana, Madhya Pradesh, Odisha, Andhra Pradesh. The highest probability is now in Maharashtra (14%).
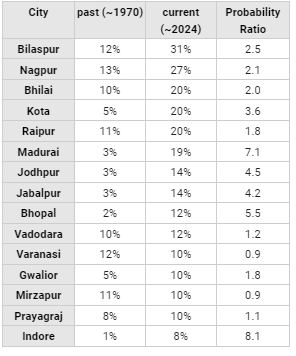
Averaging over the states smooths out differences in risk between locations. We considered the change in probability in 51 large cities across the country. A total of 37 cities now have at least a 1% chance of experiencing 40°C or warmer temperatures, and 11 have a 10% or greater probability.
With the exception of Madurai, the 15 cities with the highest risk of a day in late March being above 40° occur in the center of the country (Table 1). Bilaspur now has the highest risk (31%), and the city’s chance is now 2.5 times higher than in the 1970s. The largest change in risk between the two periods occurs in Indore. While the risk is relatively low (8%), it is 8.1 times higher than in the past. Madurai and Bhopal also have very large changes (7.1 and 5.5 times higher, respectively) and relatively high overall risk (19% and 12%).
Calculating Monthly Average Temperatures
 We extracted daily average temperatures from ERA5 from January 1, 1970 to December 31, 2023. ERA5 uses sophisticated computer models to blend meteorological observations from weather stations, balloons, and satellites. For each 0.25°-by-0.25° grid cell, we computed the mean over each month. The monthly data was then averaged across 34 states and union territories. Chandigarh and Lakshadweep were excluded from the analysis due to their small size.
Calculating Monthly Trends
For each region we used linear regression to fit a trend line for each month. The trend lines describe how the climate is changing. They are the best estimate of the most likely temperature in a given year. The actual observed temperature is then a combination of the long-term trend and variability from weather in that year.
The trend line captures the rate of warming (°C per year). These rates were multiplied by 53 to get the change in temperature since 1970. Note that this is not the difference in temperature between starting and ending years. This is the change in the long-term average conditions captured by the linear regression.
Estimating Probability of Temperatures above 40°C
The Climate Shift Index, Climate Central’s system for calculating the influence of climate change on daily air temperatures, has assembled an array of information for exploring changes in temperature. We used the system’s estimates of the frequency of different temperatures during a 31 day period centered on April 1. This covers the period of Holi in 2024.
We used the Climate Shift Index estimates of the frequency of daily temperatures in reference climate (1991-2020) for the period of interest for each ERA5 cell. This period has an average global mean temperature of 0.88°C above pre industrial levels. The Climate Shift Index system also has an estimate for how local temperatures shift in response to a 1°C change in global temperatures. This estimate is based on the trends over the period 1950-2020.
Also Read : Parmarth ensure River rejuvenation with community support
Also Read : Conclave on Climate Change, Impacts and Challenges
We then use the local climate sensitivity to shift the reference frequency distribution to the current climate (1.3°C global mean temperature) and to the past climate (0.24°C global mean temperature circa 1970). We then use these two distributions to calculate the probability of encountering a daily temperature above 40°C. The probabilities were averaged across the states and union territories. We also extracted the values for 51 cities.